
Problem Detail: In the third page (the third paragraph in the right column) of the paper “Time, Clocks, and the Ordering of Events in a Distributed System” by Leslie Lamport, it says that
The reader may find it helpful to visualize a two-dimensional spatial network of processes, which yields a three-dimensional space-time diagram. Processes and messages are still represented by lines, but tick lines become two-dimensional surfaces.
However I failed to visualize them in my head, especially the two-dimensional surfaces. Could anyone make more explanations? An illustrative picture would be excellent.
Asked By : hengxin
Answered By : rphv
Here’s my take: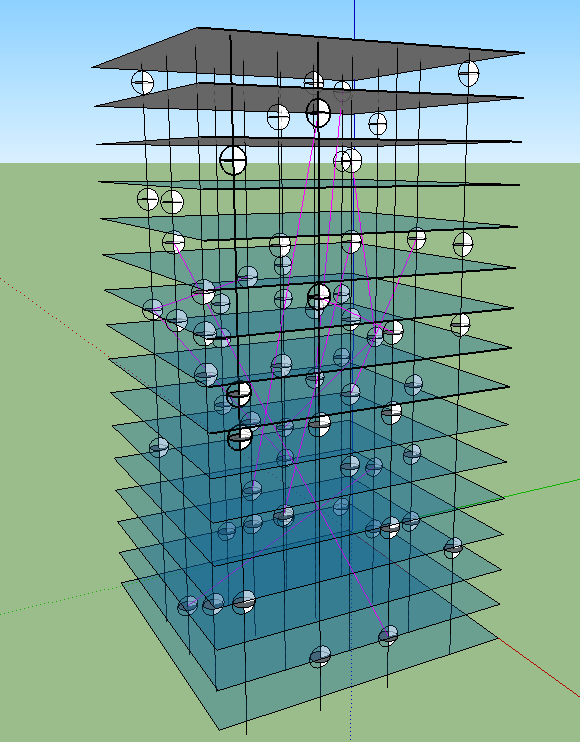 …and here’s a 3D version without the nice colors. Vertical black lines are processes; magenta lines are messages (wavy lines); spheres are events, and time is on the vertical (blue) axis. The planes are ‘tick lines.’ In Dr. Lamport’s original diagrams, messages are only passed between “adjacent” processes. Presumably in a real distributed system any process can send a message to any other process, but this is hard to draw clearly in a 2D diagram.
…and here’s a 3D version without the nice colors. Vertical black lines are processes; magenta lines are messages (wavy lines); spheres are events, and time is on the vertical (blue) axis. The planes are ‘tick lines.’ In Dr. Lamport’s original diagrams, messages are only passed between “adjacent” processes. Presumably in a real distributed system any process can send a message to any other process, but this is hard to draw clearly in a 2D diagram. Best Answer from StackOverflow
Question Source : http://cs.stackexchange.com/questions/28662 Ask a Question Download Related Notes/Documents
